


Industrial Enzymes Market by Type (Amylases, Cellulases, Proteases, Lipases, and Phytases), Application (Food & Beverages, Cleaning Agents, and Animal Feed), Source (Microorganism, Plant, and Animal), and Region - Global Forecast to 2022
USD 8,150 (Global-User License)

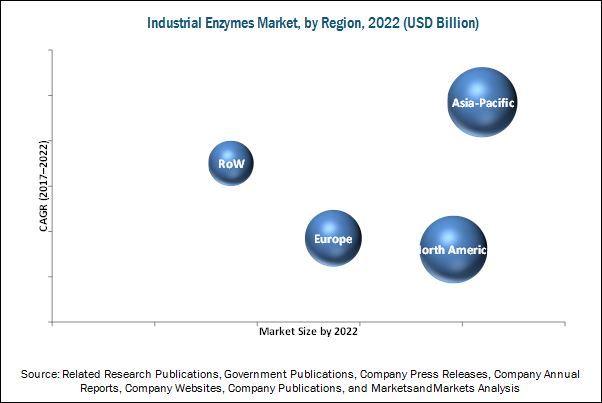
The industrial enzymes market is projected to grow at a CAGR of 5.8%, in terms of value, from 2016 to reach a projected value of USD 6.30 Billion by 2022. The market is driven by the demand from Asia-Pacific countries, particularly India, China, and Japan. Increase in demand for biofuel, advancements in R&D activities for industrial enzymes, growth in demand for consumer products, and multi-functionality of industrial enzymes are the factors driving the industrial enzymes market. The increased focus on cost reduction and resource optimization in various manufacturing processes fuels the demand for industrial enzymes.
The global market has been segmented by type, into amylases, cellulases, proteases, lipases, phytases, and others. Proteases have emerged as the most widely used industrial enzymes due to their wider application areas such as food, beverage, detergents, and pharmaceuticals. The demand for cellulases is growing, owing to the increase in industrial application of biofuels.
Based on source, the microorganism segment accounted for the largest market share in 2015. The global demand for microorganism based enzymes is higher when compared to that for plants & animals, owing to their predictable and controllable enzyme content. Factors such as reliable supplies of microbes and presence of harmful materials in plants & animals also drive the demand for the microorganism segment.
The industrial enzymes market has been segmented on the basis of application into food & beverages, cleaning agents, animal feed, and others. Industrial enzymes have a wide range of application in industries such as food, beverage, detergent, and biofuel. Enzymes have been gaining importance in various industrial processes, due to the effective catalytic properties exhibited by them. New developments in biotechnology and protein engineering provide a platform for the development of new enzymes efficiently; hence, new enzymes with improved properties are increasingly being used for technical applications such as biofuel, textile, detergent, and pharmaceutical.
The North American region accounted for the largest share, in terms of both value and volume, in the global industrial enzymes market, in 2015. Niche consumers, developed technologies, and global industrialization are the major factors driving the industrial enzymes. The rise in population, per capita income, healthcare expenditure, increase in awareness of diseases, buying power of population, and rapid growth in technologies lead to growth opportunities in Asia-Pacific and RoW.
Strict regulations imposed by different government agencies and lack of a uniform regulatory structure for the use of industrial enzymes are the factors restraining the global industrial enzymes market. Lack of transparency in patent protection laws in several countries restrains the total market.
The leading players that dominated the industrial enzymes market include BASF SE (Germany), E.I. du Pont de Nemours and Company (U.S.), Associated British Foods plc (U.K.), Koninklijke DSM N.V. (Netherlands), and Novozymes A/S (Denmark). The key players have been exploring the market in new regions by adopting acquisitions, expansions, new product launches, and agreements, partnerships, and collaborations as their preferred strategies. Key players have been increasing their technical expertise through intensive R&D investments enabling them to enhance their product offerings and capture a larger market share, thus increasing the demand for industrial enzymes.
1 Introduction (Page No. - 14)
1.1 Objectives of the Study
1.2 Market Definition
1.3 Market Scope
1.4 Periodization Considered for the Study
1.5 Currency Considered
1.6 Stakeholders
1.7 Limitations
2 Research Methodology (Page No. - 18)
2.1 Research Data
2.1.1 Secondary Data
2.1.1.1 Key Data From Secondary Sources
2.1.2 Primary Data
2.1.2.1 Key Data From Primary Sources
2.1.2.2 Key Industry Insights
2.1.2.3 Breakdown of Primaries
2.2 Factor Analysis
2.2.1 Introduction
2.2.2 Demand-Side Analysis
2.2.2.1 Emerging Economies Play A Key Role in Increasing Demand for Processed Food Products That Incorporate Enzymes
2.2.3 Supply-Side Analysis
2.2.3.1 Investment in Biotechnology Industry Enhancing the Overall Application Potential of Enzymes
2.3 Market Size Estimation
2.4 Market Breakdown & Data Triangulation
2.5 Research Assumptions & Limitations
3 Executive Summary (Page No. - 30)
4 Premium Insights (Page No. - 35)
4.1 Attractive Opportunities in Industrial Enzymes Market
4.2 Industrial Enzymes Market, By Application
4.3 Asia-Pacific Industrial Enzymes Market, By Country and By Type
4.4 Industrial Enzymes Market: Major Countries
4.5 Industrial Enzymes Market: Developed vs Developing Nations
4.6 Life Cycle Analysis, By Region
5 Market Overview (Page No. - 41)
5.1 Introduction
5.2 Market Segmentation
5.2.1 By Type
5.2.2 By Application
5.2.3 By Source
5.2.4 By Region
5.3 Evolution of Enzymes
5.4 Market Dynamics
5.4.1 Drivers
5.4.1.1 Growing Demand for Biofuel
5.4.1.2 Need for Cost Reduction and Resource Optimization
5.4.1.3 Growing Demand for Consumer Products
5.4.1.4 Multi-Functionality of Industrial Enzymes
5.4.1.5 Introduction of Genetically-Engineered Enzymes
5.4.2 Restraints
5.4.2.1 Stringent Regulations
5.4.2.2 Lack of Transparency in Patent Protection Laws
5.4.3 Opportunities
5.4.3.1 Use as Alternatives to Synthetic Chemicals
5.4.3.2 Technological Innovations and Increase in the Number of Applications
5.4.3.3 Emerging Economies With High Growth Potential
5.4.4 Challenges
5.4.4.1 Concerns Over Quality, Safety, and Consumer Perception Towards Enzymes
6 Industry Trends (Page No. - 52)
6.1 Introduction
6.2 Value Chain Analysis
6.3 Supply Chain Analysis
7 Regulatory Framework (Page No. - 55)
8 Brand Overview (Page No. - 58)
8.1 Introduction
8.2 Protease Plus
8.3 Powerflex
8.4 Ronozyme
8.5 Easyzyme
9 Industrial Enzymes Market, By Type (Page No. - 60)
9.1 Introduction
9.2 Amylases
9.3 Cellulases
9.4 Proteases
9.5 Lipases
9.6 Phytases
9.7 Others
10 Industrial Enzymes Market, By Application (Page No. - 68)
10.1 Introduction
10.2 Food & Beverages
10.2.1 Baked Goods
10.2.2 Dairy
10.2.3 Others
10.3 Cleaning Agents
10.3.1 Laundry Detergents
10.3.2 Automatic Dishwashing Detergent
10.3.3 Others
10.4 Animal Feed
10.5 Other Enzymes
11 Industrial Enzymes, By Source (Page No. - 83)
11.1 Introduction
11.2 Micro-Organisms
11.3 Plants
11.4 Animals
12 Industrial Enzymes Market, By Region (Page No. - 90)
12.1 Introduction
12.2 North America
12.2.1 U.S.
12.2.2 Canada
12.2.3 Mexico
12.3 Europe
12.3.1 Germany
12.3.2 U.K.
12.3.3 France
12.3.4 Italy
12.3.5 Rest of Europe
12.4 Asia-Pacific
12.4.1 China
12.4.2 India
12.4.3 Japan
12.4.4 Rest of Asia-Pacific
12.5 RoW
12.5.1 Latin America
12.5.2 Middle East & Africa
13 Competitive Landscape (Page No. - 117)
13.1 Overview
13.2 Market Share Analysis
13.3 Competitive Situations & Trends
13.3.1 New Product Launches
13.3.2 Expansions & Investments
13.3.3 Acquisitions
13.3.4 Partnerships, Agreements, and Collaborations
14 Company Profiles (Page No. - 127)
(Company at A Glance, Recent Financials, Products & Services, Strategies & Insights, & Recent Developments)*
14.1 Introduction
14.1.1 Geographic Revenue Mix
14.2 BASF SE
14.3 E. I. Du Pont De Nemours and Company
14.4 Associated British Foods PLC
14.5 Koninklijke DSM N.V.
14.6 Novozymes A/S
14.7 Dyadic International Inc.
14.8 Advanced Enzyme Technologies Ltd
14.9 Adisseo
14.10 Chr. Hansen Holding A/S
14.11 Amano Enzyme Inc.
*Details on Company at A Glance, Recent Financials, Products & Services, Strategies & Insights, & Recent Developments Might Not Be Captured in Case of Unlisted Companies.
15 Appendix (Page No. - 158)
15.1 Discussion Guide
15.2 Knowledge Store: Marketsandmarkets’ Subscription Portal
15.3 Introducing RT: Real-Time Market Intelligence
15.4 Available Customizations
15.5 Related Reports
List of Tables (86 Tables)
Table 1 Applications of Industrial Enzymes
Table 2 List of Business Regulators
Table 3 Enzyme Preparations Approved as Food Additives Listed in 21 Cfr 173 and Affirmed as Gras in 21cfr 184
Table 4 Industrial Enzymes Market, By Type, 2015–2022 (USD Billion)
Table 5 Application of Amylases in Various Sectors
Table 6 Amylases Market Size, By Region, 2015–2022 (USD Million)
Table 7 Cellulases Market Size, By Region, 2015–2022 (USD Million)
Table 8 Types of Protease and Their Sources
Table 9 Proteases Market Size, By Region, 2015–2022 (USD Million)
Table 10 Lipases Market Size, By Region, 2015–2022 (USD Million)
Table 11 Phytases Market Size, By Region, 2015–2022 (USD Million)
Table 12 Others Types Market Size, By Region, 2015–2020 (USD Million)
Table 13 Industrial Enzymes Market, By Application, 2015–2022 (USD Million)
Table 14 Enzyme Application in the Dairy Industry
Table 15 Enzyme Applications in the Bakery Industry
Table 16 Enzyme Application in the Juice Industry
Table 17 Enzyme Application in the Brewing Industry
Table 18 Industrial Enzymes Market Size for Food & Beverages, By Region, 2015–2022 (USD Million)
Table 19 Industrial Enzymes in Food & Beverages Market Size, By Product, 2015–2022 (USD Million)
Table 20 Industrial Enzymes in Baked Goods Market Size, By Region, 2015–2022 (USD Million)
Table 21 Industrial Enzymes in Dairy Products Market Size, By Region, 2015–2022 (USD Million)
Table 22 Industrial Enzymes Market Size for Others, By Region, 2015–2022 (USD Million)
Table 23 Enzyme Applications in Laundry Detergents
Table 24 Industrial Enzymes Market Size for Cleaning Agents, By Region, 2015–2022 (USD Million)
Table 25 Industrial Enzymes Market Size for Cleaning Agents, By End-Use, 2015–2022 (USD Million)
Table 26 Industrial Enzymes in Laundry Detergents Market Size, By Region, 2015–2022 (USD Million)
Table 27 Industrial Enzymes Market Size for Automatic Dishwashing Detergents, By Region, 2015–2022 (USD Million)
Table 28 Industrial Enzymes Market Size for Other Cleaning Products, By Region, 2015–2022 (USD Million)
Table 29 Industrial Enzymes Market Size for Animal Feed, By Region, 2015–2022 (USD Million)
Table 30 Industrial Enzymes Market Size for Animal Feed, By Type, 2015–2022 (USD Million)
Table 31 Phytases in Animal Feed Market Size, By Region, 2015–2022 (USD Million)
Table 32 Other Enzymes in Animal Feed Market Size, By Region, 2015–2022 (USD Million)
Table 33 Industrial Enzymes Market Size, By Source, 2015–2022 (USD Million)
Table 34 Micro-Organisms-Based Enzymes and Their Sources
Table 35 Industrial Enzymes From Micro-Organisms Market Size, By Region, 2015–2022 (USD Million)
Table 36 Plant-Based Enzymes and Their Sources
Table 37 Industrial Enzymes From Plant Sources Market Size, By Region, 2015–2022 (USD Million)
Table 38 Animal-Based Enzymes and Their Sources
Table 39 Industrial Enzymes From Animal Sources Market Size, By Region, 2015–2022 (USD Million)
Table 40 Industrial Enzymes Market Size, By Region, 2015–2022 (USD Million)
Table 41 North America: Industrial Enzymes Market Size, By Country, 2015–2022 (USD Million)
Table 42 North America: Market Size, By Application, 2015–2022 (USD Million)
Table 43 North America: Market Size for Food & Beverages, By Product, 2015-2022 (USD Million)
Table 44 North America: Market Size for Cleaning Agents, By End Use, 2015-2022 (USD Million)
Table 45 North America: Market Size for Animal Feed, By Type, 2015-2022 (USD Million)
Table 46 North America: Market Size, By Type, 2015-2022 (USD Million)
Table 47 North America: Market Size, By Source, 2015-2022 (USD Million)
Table 48 U.S.: Industrial Enzymes Market Size, By Application, 2015-2022 (USD Million)
Table 49 Canada: Industrial Enzymes Market Size, By Application, 2015-2022 (USD Million)
Table 50 Mexico: Industrial Enzymes Market Size, By Application, 2015-2022 (USD Million)
Table 51 Europe: Industrial Enzymes Market Size, By Country, 2015-2022 (USD Million)
Table 52 Europe: Market Size, By Application, 2015-2022 (USD Million)
Table 53 Europe: Market Size for Food & Beverages, By Product, 2015-2022 (USD Million)
Table 54 Europe: Market Size for Cleaning Agents, By End Use, 2015-2022 (USD Million)
Table 55 Europe: Market Size for Animal Feed, By Type, 2015-2022 (USD Million)
Table 56 Europe: Market Size, By Type, 2015-2022 (USD Million)
Table 57 Europe: Market Size, By Source, 2015-2022 (USD Million)
Table 58 Germany: Industrial Enzymes Market Size, By Application, 2015-2022 (USD Million)
Table 59 U.K.: Industrial Enzymes Market Size, By Application, 2015-2022 (USD Million)
Table 60 France: Industrial Enzymes Market Size, By Application, 2015-2022 (USD Million)
Table 61 Italy: Industrial Enzymes Market Size, By Application, 2015-2022 (USD Million)
Table 62 Rest of Europe: Industrial Enzymes Market Size, By Application, 2015-2022 (USD Million)
Table 63 Asia-Pacific: Industrial Enzymes Market Size, By Country, 2015–2022 (USD Million)
Table 64 Asia-Pacific: Market Size, By Application, 2015–2022 (USD Million)
Table 65 Asia-Pacific: Market Size, By Food & Beverages Product, 2015–2022 (USD Million)
Table 66 Asia-Pacific: Cleaning Agents Industrial Enzymes Market Size, By Product, 2015–2022 (USD Million)
Table 67 Asia-Pacific: Animal Feed Industrial Enzymes Market Size, By Type, 2015–2022 (USD Million)
Table 68 Asia-Pacific: Industrial Enzymes Market Size, By Type, 2015–2022 (USD Million)
Table 69 Asia-Pacific: Market Size, By Source, 2015–2022 (USD Million)
Table 70 China: Industrial Enzymes Market Size, By Application, 2015–2022 (USD Million)
Table 71 India: Industrial Enzymes Market Size, By Application, 2015–2022 (USD Million)
Table 72 Japan: Industrial Enzymes Market Size, By Application, 2015–2022 (USD Million)
Table 73 Rest of Asia-Pacific: Industrial Enzymes Market Size, By Application, 2015–2022 (USD Million)
Table 74 RoW: Industrial Enzymes Market, By Region, 2015–2022 (USD Million)
Table 75 RoW: Market, By Application, 2015–2022 (USD Million)
Table 76 RoW: Market, By Food & Beverages Product, 2015–2022 (USD Million)
Table 77 Cleaning Agents Industrial Enzymes Market, By End Use, 2015–2022 (USD Million)
Table 78 RoW: Industrial Enzymes Market for Animal Feed, By Type, 2015–2022 (USD Million)
Table 79 RoW: Market, By Type, 2015–2022 (USD Million)
Table 80 RoW: Market, By Source, 2015–2022 (USD Million)
Table 81 Latin America: Industrial Enzymes Market, By Application, 2015–2022 (USD Million)
Table 82 Middle East & Africa: Industrial Enzymes Market, By Application, 2015 – 2022 (USD Million)
Table 83 New Product Launches, 2010–2016
Table 84 Expansions & Investments, 2010–2016
Table 85 Acquisitions, 2010–2016
Table 86 Partnerships, Agreements & Collaborations, 2010–2016
List of Figures (59 Figures)
Figure 1 Market Segmentation
Figure 2 Geographic Scope of the Industrial Enzymes Market
Figure 3 Industrial Enzymes Market: Research Design
Figure 4 Rise in Disposable Income has Resulted in Increase in Demand for Consumer Goods
Figure 5 Key Economies Based on GDP 2011-2015 (USD Trillion)
Figure 6 Total Biotechnology R&D Expenditures in 2013
Figure 7 Market Size Estimation Methodology: Bottom-Up Approach
Figure 8 Market Size Estimation Methodology: Top-Down Approach
Figure 9 Data Triangulation Methodology
Figure 10 Assumptions of the Research Study
Figure 11 Limitations of the Research Study
Figure 12 Industrial Enzymes Market Growth Trend, 2017 vs 2022 (USD Billion)
Figure 13 Asia-Pacific is Projected to Be the Fastest-Growing Market for Industrial Enzymes During the Forecast Period
Figure 14 Food & Beverages Segment to Dominate the Global Industrial Enzymes Market, By Application
Figure 15 Industrial Enzymes Market, By Type, 2017 vs 2022
Figure 16 Major Players Adopted New Product Launches as the Key Strategy From 2011 to 2016
Figure 17 Emerging Markets With Promising Growth Potential, 2017–2022
Figure 18 Animal Feed Segment is Projected to Grow at the Highest CAGR From 2017 to 2022
Figure 19 Proteases Segment Would Account for Largest Share in the Asia-Pacific Industrial Enzymes Market, 2016
Figure 20 India to Grow at Highest CAGR in Industrial Enzymes Market, 2017–2022
Figure 21 Developing Markets Show Strong Growth Opportunities During the Forecast Period
Figure 22 Industrial Enzymes Market is Projected to Experience Strong Growth in the Asia-Pacific Region
Figure 23 Industrial Enzymes Market Segmentation, By Type
Figure 24 Market Segmentation, By Application
Figure 25 Market Segmentation, By Source
Figure 26 Market Segmentation, By Region
Figure 27 Evolution of Enzymes
Figure 28 Factors Affecting Growth of the Industrial Enzymes Market
Figure 29 Research & Development and Production of Industrial Enzymes Contribute the Most to the Overall Value
Figure 30 Manufacturers Play A Vital Role in the Supply Chain for Industrial Enzyme Products
Figure 31 Proteases Segment is Estimated to Dominate the Industrial Enzymes Market in 2017
Figure 32 Asia-Pacific is Estimated to Dominate the Proteases Segment in 2017
Figure 33 Baked Goods Segment to Lead the Industrial Enzymes Market, By Application, 2017 vs 2022 (USD Million)
Figure 34 Industrial Enzymes Market Size for Cleaning Agents, By Region, 2017 vs 2022 (USD Million)
Figure 35 Laundry Detergents Dominate the Industrial Enzymes Market for Cleaning Agents By 2022
Figure 36 Industrial Enzymes Market Size for Animal Feed, By Region, 2017 vs 2022 (USD Million)
Figure 37 Micro-Organisms Segment is Estimated to Dominate the Industrial Enzymes Market in 2017
Figure 38 Asia-Pacific is Estimated to Dominate the Micro-Organisms Segment in 2017
Figure 39 Geographic Snapshot (2017–2022):India is Estimated to Grow at the Highest CAGR
Figure 40 North America: Industrial Enzymes Market: A Snapshot
Figure 41 European Industrial Enzymes Market Snapshot
Figure 42 Asia-Pacific Industrial Enzymes Market: A Snapshot
Figure 43 Key Strategies Adopted By Companies From 2010 to 2016
Figure 44 Market Share Analysis: Global Enzymes Market
Figure 45 New Product Launches: Growth & Innovation in the Industrial Enzymes Industry
Figure 46 New Product Launches: the Key Strategy, 2010–2016
Figure 47 Annual Developments in the Industrial Enzyme Market, 2010–2016
Figure 48 Geographic Revenue Mix of Top Five Market Players
Figure 49 BASF SE: Company Snapshot
Figure 50 BASF SE: SWOT Analysis
Figure 51 E.I. Du Pont De Nemours and Company: Company Snapshot
Figure 52 E.I. Du Pont De Nemours and Company: SWOT Analysis
Figure 53 Associated British Foods PLC: Company Snapshot
Figure 54 Koninklijke DSM N.V.: Company Snapshot
Figure 55 Novozymes A/S: Company Snapshot
Figure 56 Dyadic International Inc.: Company Snapshot
Figure 57 Advanced Enzyme Technologies Ltd: Company Snapshot
Figure 58 Adisseo: Company Snapshot
Figure 59 Chr. Hansen Holding A/S: Company Snapshot
